A stem-and-leaf plot is a display that organizes data from least to greatest. The digits of the least place value form the leaves, and the next place-value digits form the stems. The stem-and-leaf plot shows Marcia's scores on several tests. Find the mean test score.
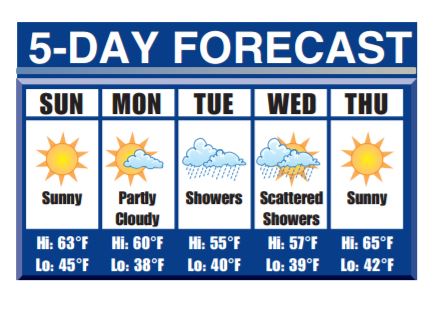
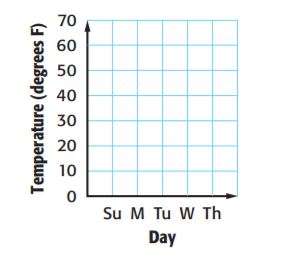
Multiple Representations The graphic shows the 5 -day forecast a. Numbers What is the difference between the mean high and mean low temperature for this 5 -day period? Justify your answer.
The difference between the mean high and mean low:
Persevere with Problems The mean of a set of data is 45 years. Find the missing numbers in the data set {40, 45, 48, ?, 54,?, 45}. Explain the method or strategy you used.
 Dear guest, you are not a registered member. As a guest, you only have read-only access to our books, tests and other practice materials.
 (request help)
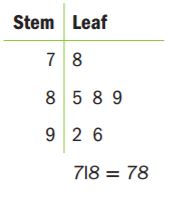
 (show solution)