Dear guest, you are not a registered member. As a guest, you only have read-only access to our books, tests and other practice materials.
As a registered member you can:
- View all solutions for free
- Request more in-depth explanations for free
- Ask our tutors any math-related question for free
- Email your homework to your parent or tutor for free
Registration is free and doesn't require any type of payment information. Click here to
Register.
Grade 6 McGraw Hill Glencoe - Answer Keys
Chapter 12:Statistical Display;Lesson 2:Histograms
Please share this page with your friends on FaceBook
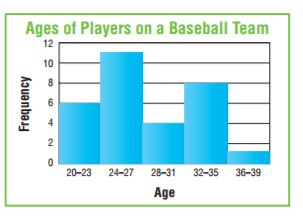
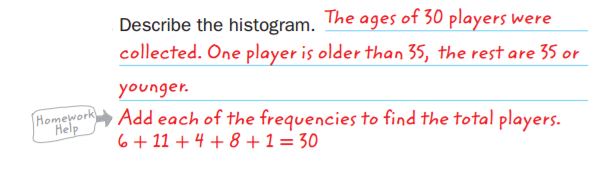
For Exercises 12-16, use the histogram.
|
|
|
-
Question 13
 (request help) (request help)
Which interval represents the greatest number of players?
|
|
|
|
-
Question 16
(request help)
How many players have ages in the interval 32-35?
|
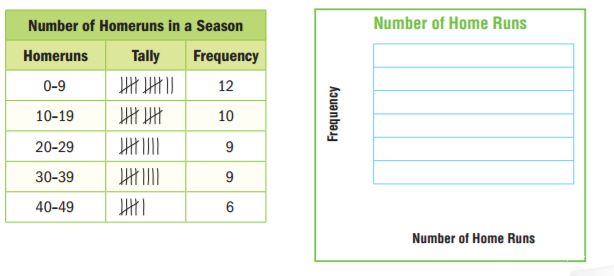
Model with Mathematics Draw a histogram to represent the set of data. |
|
|
-
Question 18
(request help)
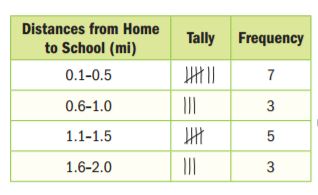
Find the Error Pilar is analyzing the frequency table below. Find her mistake and correct it.

|
 (show solution)