 Dear guest, you are not a registered member. As a guest, you only have read-only access to our books, tests and other practice materials.
As a registered member you can:
- View all solutions for free
- Request more in-depth explanations for free
- Ask our tutors any math-related question for free
- Email your homework to your parent or tutor for free
Registration is free and doesn't require any type of payment information. Click here to
Register.
Statistical Display - Test 2
Keywords: Common Core, Statistical Display
Draw a box plot for each set of data. |
-
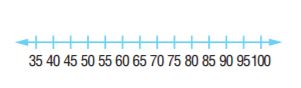
Question 1
{65, 92, 74, 61, 55, 35, 88, 99,97, 100, 96}
|
-
Question 2
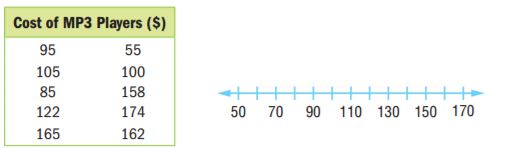
|
-
Question 3
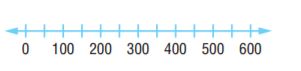
The table shows the length of coastline for the 13 states along the Atlantic Coast.
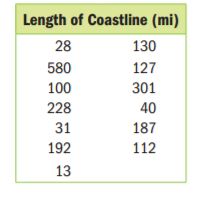
a. Make a box plot of the data.
|
-
Question 4
b. Half of the states have a coastline less than how many miles?
|
-
Question 5
c. Write a sentence describing what the length of the box plot tells about the number of miles of coastline for states along the Atlantic coast.
|
-
Question 6
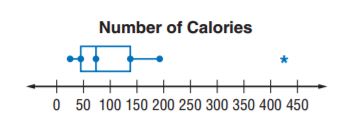
The amount of Calories for a serving of certain fruits is displayed. Find the median and the measures of variability. Then describe the data.
|