Sorry, members only. If you are not a registered user, please register first or log in! (it's free)
Question 3
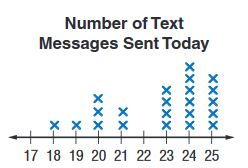
The line plot shows the number of text messages sent by different students in one day.
a. Choose the appropriate measures to describe the center and spread of the distribution. Justify your response based on the shape of the distribution.
Sorry, members only. If you are not a registered user, please register first or log in! (it's free)
Question 5
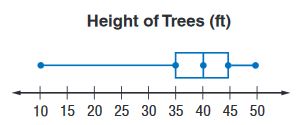
A distribution that is not symmetric is called skewed. A distribution that is skewed left shows data that is more spread out on the left side than on the right side. A distribution that is skewed right shows data that is more spread out on the right side than on the left side.The box plot shows the heights in feet of several trees.
a. Explain how you know the distribution is not symmetric.
Sorry, members only. If you are not a registered user, please register first or log in! (it's free)
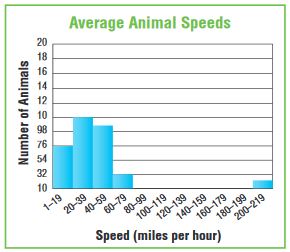
Question 7
c. Use appropriate measures to describe the center and spread of the distribution. Justify your choice of measure based on the shape of the distribution.
 Dear guest, you are not a registered member. As a guest, you only have read-only access to our books, tests and other practice materials.