×
Dear guest, you are not a registered member . As a guest, you only have read-only access to our books, tests and other practice materials.
As a registered member you can:
View all solutions for free
Request more in-depth explanations for free
Ask our tutors any math-related question for free
Email your homework to your parent or tutor for free
Registration is free and doesn't require any type of payment information. Click here to
Register .
Grade 8 HMH Go Math - Answer Keys
Chapter 3: Proportional Relationships; Lesson 1: Representing Proportional Relationships
Please share this page with your friends on FaceBook
Question 13
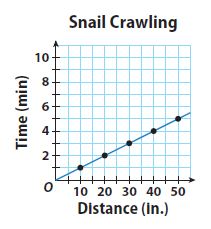
The graph shows the relationship between the distance that a snail crawls and the time that it crawls.a. Use the points on the graph to make a table.
Type below:
Question 13
b. Write the equation for the relationship and tell what each variable represents.
Type below:
Question 13
c. How long does it take the snail to crawl 85 inches?
H.O.T.
Focus on Higher Order Thinking
Question 14
Communicate Mathematical Ideas
Explain why all of the graphs in this lesson show the first quadrant but omit the other three quadrants.
Type below:
Question 15
Analyze Relationships
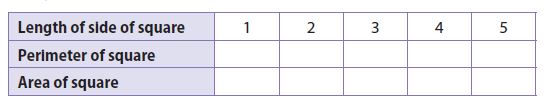
Complete the table.
a. Are the length of a side of a square and the perimeter of the square related proportionally? Why or why not?
Question 15
b . Are the length of a side of a square and the area of the square related proportionally? Why or why not?
Question 16
Make a Conjecture
A table shows a proportional relationship where k is the constant of proportionality. The rows are then switched. How does the new constant of proportionality relate to the original one?
Type below:
 Dear guest, you are not a registered member. As a guest, you only have read-only access to our books, tests and other practice materials.
 (request help)
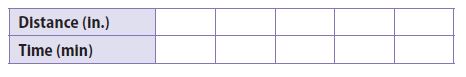
 (show solution)