×
Dear guest, you are not a registered member . As a guest, you only have read-only access to our books, tests and other practice materials.
As a registered member you can:
View all solutions for free
Request more in-depth explanations for free
Ask our tutors any math-related question for free
Email your homework to your parent or tutor for free
Registration is free and doesn't require any type of payment information. Click here to
Register .
Grade 8 HMH Go Math - Answer Keys
Chapter 6: Functions; Lesson 4: Analyzing Graphs
Please share this page with your friends on FaceBook
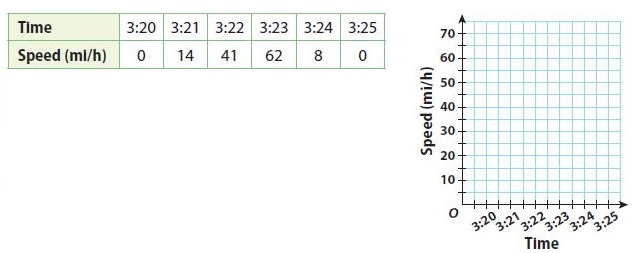
The data in the table shows the speed of a ride at an amusement park at different times one afternoon.
Question 11
Sketch a graph that shows the speed of the ride over time.
Type below:
Question 12
Between which times is the ride’s speed increasing the fastest?
Type below:
Question 13
Between which times is the ride’s speed decreasing the fastest?
Type below:
H.O.T.
Focus on Higher Order Thinking
Question 14
Justify Reasoning
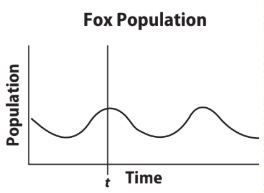
What is happening to the fox population before time t? Explain your reasoning.
Type below:
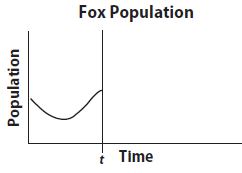
Question 15
What If?
Suppose at time t, a conservation organization moves a large group of foxes to the island. Sketch a graph to show how this action might affect the population on the island after time t.
Type below:
Question 16
Make a Prediction
At some point after time t, a forest fire destroys part of the woodland area on the island. Describe how your graph from problem 15 might change.
Type below:
 Dear guest, you are not a registered member. As a guest, you only have read-only access to our books, tests and other practice materials.
 (request help)
 (show solution)