 Dear guest, you are not a registered member. As a guest, you only have read-only access to our books, tests and other practice materials.
As a registered member you can:
- View all solutions for free
- Request more in-depth explanations for free
- Ask our tutors any math-related question for free
- Email your homework to your parent or tutor for free
Registration is free and doesn't require any type of payment information. Click here to
Register.
Grade 8 HMH Go Math - Answer Keys
Chapter 14:Scatter Plots; Lesson 1: Scatter Plots and Association
Please share this page with your friends on FaceBook
Guided Practice
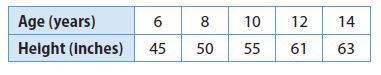
Bob recorded his height at different ages. The table below shows his data.
|
-
Question 1
 (request help) (request help)
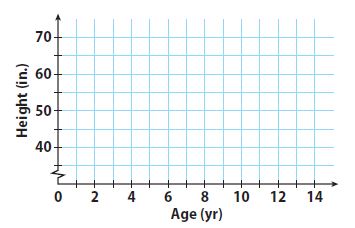
Make a scatter plot of Bob’s data.
Type below:
|
-
Question 2
(request help)
Describe the association between Bob’s age and his height. Explain the association.
Type below:
|
-
Question 3
(request help)
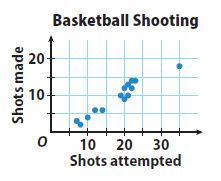
The scatter plot shows the basketball shooting results for 14 players. Describe any clusters you see in the scatter plot. Identify any outliers.
Type below:
|
ESSENTIAL QUESTION CHECK-IN |
-
Question 4
(request help)
Explain how you can make a scatter plot from a set of bivariate data.
Type below:
|
 (show solution)