×
Dear guest, you are not a registered member . As a guest, you only have read-only access to our books, tests and other practice materials.
As a registered member you can:
View all solutions for free
Request more in-depth explanations for free
Ask our tutors any math-related question for free
Email your homework to your parent or tutor for free
Registration is free and doesn't require any type of payment information. Click here to
Register .
Grade 8 HMH Go Math - Answer Keys
Chapter 14:Scatter Plots; Lesson 2: Trend Lines and Predictions
Please share this page with your friends on FaceBook
Guided Practice Angela recorded the price of different weights of several bulk grains. She made a scatter plot of her data. Use the scatter plot for 1–4.
Question 1
Draw a trend line for the scatter plot.
Type below:
Question 2
How do you know whether your trend line is a good fit for the data?
Type below:
Question 3
Write an equation for your trend line.
Type below:
Question 4
Use the equation for your trend line to interpolate the price of 7 ounces and extrapolate the price of 50 ounces.
Type below:
ESSENTIAL QUESTION CHECK-IN
Question 5
A trend line passes through two points on a scatter plot. How can you use the trend line to make a prediction between or outside the given data points?
Type below:
 Dear guest, you are not a registered member. As a guest, you only have read-only access to our books, tests and other practice materials.
 (request help)
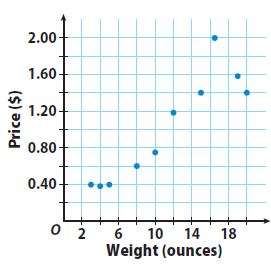
 (show solution)