 Dear guest, you are not a registered member. As a guest, you only have read-only access to our books, tests and other practice materials.
As a registered member you can:
- View all solutions for free
- Request more in-depth explanations for free
- Ask our tutors any math-related question for free
- Email your homework to your parent or tutor for free
Registration is free and doesn't require any type of payment information. Click here to
Register.
Grade 5 HMH Go Math - NEW
Please share this page with your friends on FaceBook
Share and Show
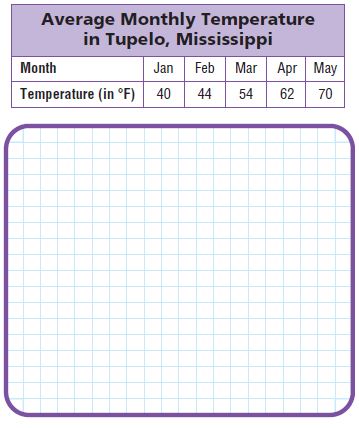
Use the table at the right for 1–3.
|
-
Question 1
 (request help) (request help)
What scale and intervals would be appropriate to make a graph of the data?
Type below:
|
-
Question 2
(request help)
Write the related pairs as ordered pairs.
Type below:
|
|
|
-
Question 4
(request help)
Use the graph to determine between which two months the least change in average temperature occurs.
Type below:
|
On Your Own
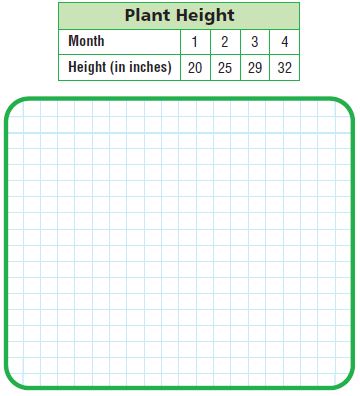
Use the table at the right for 5–7.
|
-
Question 5
(request help)
Write the related number pairs for the plant height as ordered pairs.
Type below:
|
-
Question 6
(request help)
What scale and intervals would be appropriate to make a graph of the data?
Type below:
|
|
|
-
Question 8
(request help)
Use the graph to find the difference in height between Month 1 and Month 2.
Type below:
|
-
Question 9
(request help)
Use the graph to estimate the height at \(1\frac{1}{2}\) months.
-
|
 (show solution)