×
Dear guest, you are not a registered member . As a guest, you only have read-only access to our books, tests and other practice materials.
As a registered member you can:
View all solutions for free
Request more in-depth explanations for free
Ask our tutors any math-related question for free
Email your homework to your parent or tutor for free
Registration is free and doesn't require any type of payment information. Click here to
Register .
Grade 6 HMH Go Math - Answer Keys
Please share this page with your friends on FaceBook
Share and Show
For 1–3, use the dot plot.
Question 1
The dot plot shows the number of paintings students in the art club displayed at the art show. Does the dot plot contain any gaps?
If so, where?
Type below:
Question 2
Identify any clusters in the data.
Type below:
Question 3
Summarize the information in the dot plot.
Type below:
On Your Own
Question 4
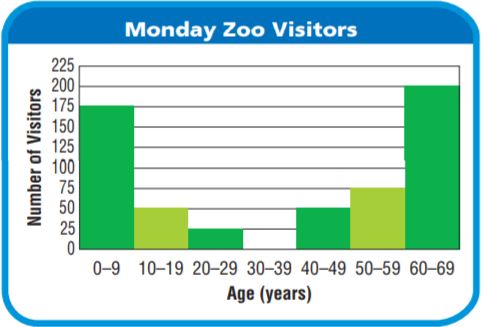
What patterns do you see in the histogram data?
Type below:
Question 5
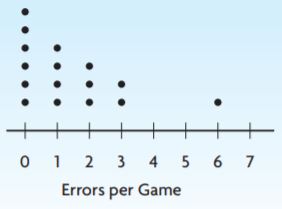
The dot plot shows the number of errors made by a baseball team in the first 16 games of the season. For numbers 5a-5e, choose Yes or No to indicate whether the statement is correct.
5a . There is a gap from 4 to 5.
5b . There is a peak at 0.
5c . The dot plot has symmetry.
5d . There are two modes.
5e . There is one cluster.
 Dear guest, you are not a registered member. As a guest, you only have read-only access to our books, tests and other practice materials.
 (request help)
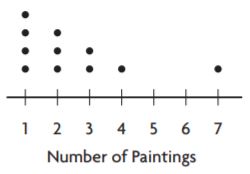
 (show solution)