 Dear guest, you are not a registered member. As a guest, you only have read-only access to our books, tests and other practice materials.
As a registered member you can:
- View all solutions for free
- Request more in-depth explanations for free
- Ask our tutors any math-related question for free
- Email your homework to your parent or tutor for free
Registration is free and doesn't require any type of payment information. Click here to
Register.
Grade 6 HMH Go Math - Answer Keys
Please share this page with your friends on FaceBook
-
Question 3
 (request help) (request help)
The data set shows the scores of the players on the winning team of a basketball game.
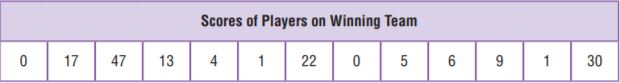
The median is _____.
The lower quartile is _____.
The upper quartile is _____.
-
|
-
Question 4
(request help)
The data set shows the number of desks in 12 different classrooms.
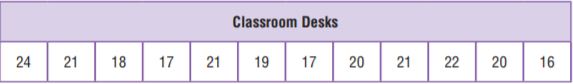
Find the values of the points on the box plot.

Type below:
|
-
Question 5
(request help)
The box plot shows the number of boxes sold at an office supply store each day for a week.
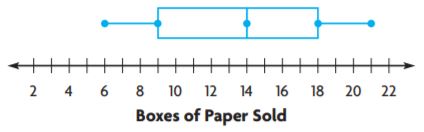
For numbers 5a–5d, select True or False for each statement.
5a. The median is 18.
5b. The range is 15.
5c. The interquartile range is 9.
5d. The upper quartile is 18.
-
|
 (show solution)