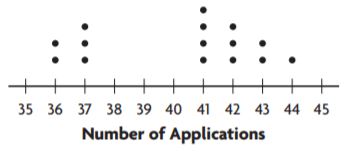
Jordan surveyed a group of randomly selected smartphone users and asked them how many applications they have downloaded onto their phones. The dot plot shows the results of Jordan's survey. Select the statements that describe patterns in the data. Mark all that apply.
 Dear guest, you are not a registered member. As a guest, you only have read-only access to our books, tests and other practice materials.
 (request help)
 (show solution)