 Dear guest, you are not a registered member. As a guest, you only have read-only access to our books, tests and other practice materials.
As a registered member you can:
- View all solutions for free
- Request more in-depth explanations for free
- Ask our tutors any math-related question for free
- Email your homework to your parent or tutor for free
Registration is free and doesn't require any type of payment information. Click here to
Register.
Grade 8 McGraw Hill Glencoe - Answer Keys
Please share this page with your friends on FaceBook
Power Up
Test Practice |
-
Question 15
 (request help) (request help)
The graph represents the amount of pies sold by a bakery over the course of one day. Determine if each of the following statements is true or false.

a. The red segment represents sales increasing at a constant rate.
b. The blue segment represents sales, decreasing at a constant rate.
c. The green segment represents sales increasing, but not at a constant rate.
-
|
-
Question 16
(request help)
The graph represents Jenny's activities on her way home from school on a given day. Match each statement with its corresponding segment on the graph.
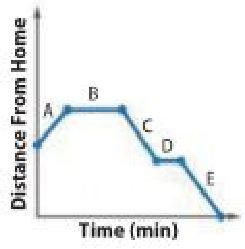
Jenny rides her bike from the park to Allison's house. _____
Jenny rides her bike home from Allison's house. _____
Jenny plays at the park. _____
Jenny visits Allison at her house. _____
Jenny rides her bike from school to the park. _____
-
|
Spiral Review
Simplify each expression. |
|
|
|
|
|
|
 (show solution)