Kayla recorded data on how many Calories she burned for different lengths of time while jogging on a treadmill. She plotted the data in a scatter plot and drew the line of best fit. The equation for the line is \(\text{C} = 14.5\text{m}\), where C represents the number of Calories burned and m represents the number of minutes spent jogging. Determine if each statement is true or false.
a. The slope is positive because as Kayla jogs more minutes, she burns more Calories.
b. According to the line of best fit, Kayla will burn about 290 Calories if she jogs 20 minutes.
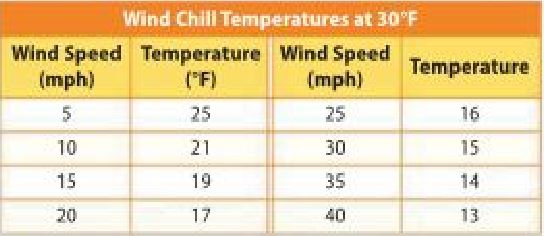
The table shows the windchill temperatures for different wind speeds when the outsiude temperature is 30°F. Construct a scatter plot of the data. Then draw a line of best fit.
Does the line of best fit have a positive or negative slope? Explain what this represents.
 Dear guest, you are not a registered member. As a guest, you only have read-only access to our books, tests and other practice materials.
 (request help)
 (show solution)