One hundred customers in a restaurant were asked whether they like chicken or beef and whether they liked rice or pasta. Out of 30 customers that liked rice, 20 liked chicken. There were students that liked chicken. Construct a two-way table summarizing the data.
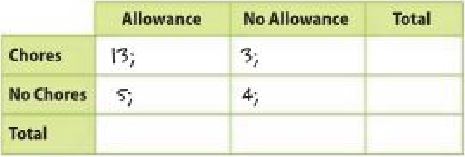
The two-way table shows the number of students that do or do not do chores at home and whether they receive an allowance or not. Find and interpret the relative frequencies of students in the survey by columns.
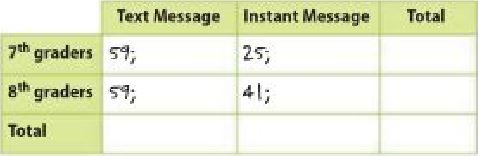
The two-way table shows the number of students that message on a daily basis. Find and interpret the relative frequencies of students in the survey by rows.
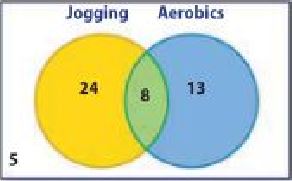
Use Math Tools The Venn diagram shows the number of students that exercise in different ways. Construct a two-way table that displays the data. Find and interpret the relative frequencies by column.
 Dear guest, you are not a registered member. As a guest, you only have read-only access to our books, tests and other practice materials.
 (request help)
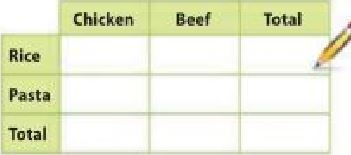
 (show solution)