×
Dear guest, you are not a registered member . As a guest, you only have read-only access to our books, tests and other practice materials.
As a registered member you can:
View all solutions for free
Request more in-depth explanations for free
Ask our tutors any math-related question for free
Email your homework to your parent or tutor for free
Registration is free and doesn't require any type of payment information. Click here to
Register .
Grade 8 McGraw Hill Glencoe - Answer Keys
Please share this page with your friends on FaceBook
Independent Practice
Question 1
The scores for Ms. Hermes math class are shown in the histogram. Describe the shape of the distribution shown, identify any clusters, gaps, peaks, or outliers.
Type below:
Question 2
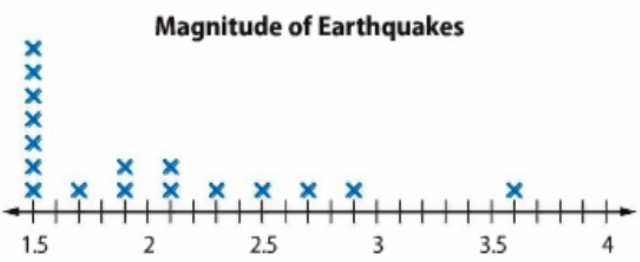
The magnitude of several earthquakes is shown in the line plot at the right.
a . Describe the shape of the distribution shown. Identify any clusters, gaps, peaks, or outliers.
Type below:
Question 2
b . Describe the center and spread of the distribution. Justify your response based on the shape of the distribution.
Type below:
Question 3
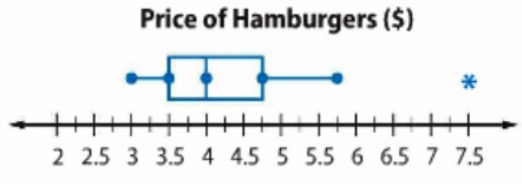
The box plot shows the price of hamburgers at different restaurants.
a . Describe the shape of the distribution using symmetry and outliers.
Type below:
Question 3
b . Describe the center and spread of the distribution. Justify your response based on the shape of the distribution.
Type below:
 Dear guest, you are not a registered member. As a guest, you only have read-only access to our books, tests and other practice materials.
 (request help)
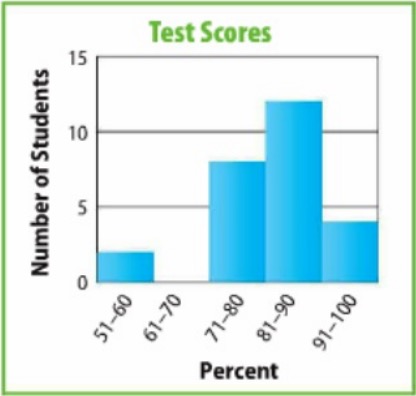
 (show solution)