Dear guest, you are not a registered member. As a guest, you only have read-only access to our books, tests and other practice materials.
As a registered member you can:
View all solutions for free
Request more in-depth explanations for free
Ask our tutors any math-related question for free
Email your homework to your parent or tutor for free
Registration is free and doesn't require any type of payment information. Click here to
Register.
Grade 8 McGraw Hill Glencoe - Answer Keys
Please share this page with your friends on FaceBook
Power UpPerformance Task
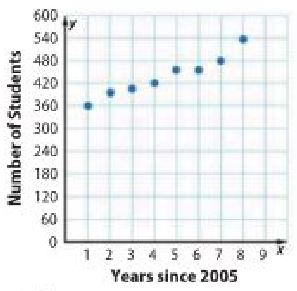
Grand Expansion
Midtown Independent School is making plans to move to a new building to meet the increasing number of students in its middle school. The school's enrollment over the last several years is shown in the scatter plot.
Write your answers on another piece of paper. Show all of your work to receive full credit.
Draw a line of best fit on the graph. Interpret the scatter plot based on the shape of the distribution. Explain what this means in regard to enrollment.
The school must move to the new building once enrollment exceeds 690 students. If the enrollment continues to increase at the current rate, what year must the new building be ready?
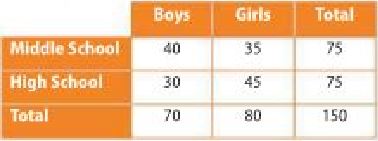
The two-way table shows the number of boys and girls who play sports in the middle school and high school. Find the relative frequencies of the students by columns to the nearest percent. Two hundred fifty new lockers will be purchased. The new lockers will be placed in the locker rooms based on the current distribution of students playing sports. Determine how the lockers should be distributed. Explain.
 Dear guest, you are not a registered member. As a guest, you only have read-only access to our books, tests and other practice materials.
 (request help)
 (show solution)