×
Dear guest, you are not a registered member . As a guest, you only have read-only access to our books, tests and other practice materials.
As a registered member you can:
View all solutions for free
Request more in-depth explanations for free
Ask our tutors any math-related question for free
Email your homework to your parent or tutor for free
Registration is free and doesn't require any type of payment information. Click here to
Register .
Grade 5 Eureka - Answer Keys Module 4
Please share this page with your friends on FaceBook
Question 1
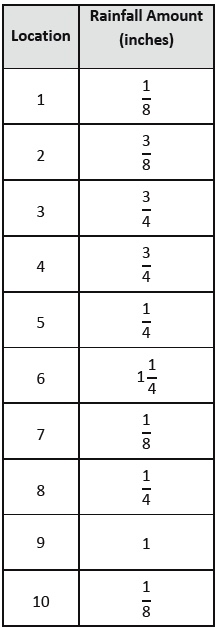
A meteorologist set up rain gauges at various locations around the city and recorded the rainfall amounts in the table below. Use the data in the table to create a line plot using \(\cfrac{1}{8}\) inches.
a . Which location received the most rainfall?
Type below:
Question 1
b . Which location received the least rainfall?
Type below:
Question 1
c . Which rainfall measurement was the most frequent?
Type below:
 Dear guest, you are not a registered member. As a guest, you only have read-only access to our books, tests and other practice materials.
 (request help)
 (show solution)