Please share this page with your friends on FaceBook
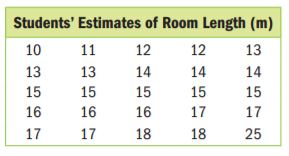
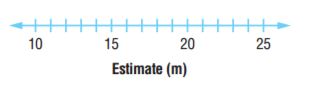
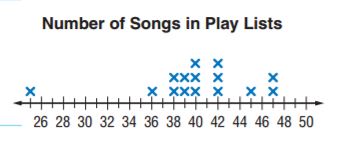
Make a line plot for each set of data. Find the median, mode, range, and any outliers of the data shown In the line plot.Then describe the data using them.
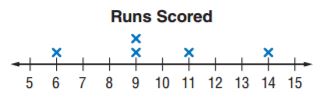
Inductive Reasoning The number of runs a softball team scored in their last five games Is shown in the line plot. How many runs would the team need to score in the next game so that each statement Is true?
 Dear guest, you are not a registered member. As a guest, you only have read-only access to our books, tests and other practice materials.
 (request help)
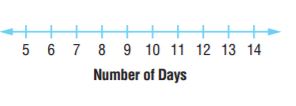
 (show solution)