Model with Mathematics Write a survey question that has a numerical answer. Some examples are"How many CDs do you have?" or "How many feet long is your bedroom? Ask your friends and family the question. Record the results and organize the data in a line plot. Use the line plot to make conclusions about your data. For example, describe the data using the measures of center and variability.
Persevere with Problems There are several sizes of flying disks in a collection. The range is 8 centimeters. The median is 22 centimeters. The smallest size is 16 centimeters. What is the largest disk in the collection?
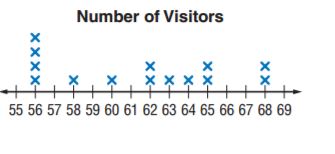
Reason Inductively The line plot shows the number of student visitors to the National Wildlife Refuge each day for two weeks. If the four Xs at 56 were not included in the data set, which measure of center would be most affected? Justify your response.
 Dear guest, you are not a registered member. As a guest, you only have read-only access to our books, tests and other practice materials.
 (request help)

 (show solution)