Please share this page with your friends on FaceBook
Make a line plot for each set of data. Find the median, mode, range, and any outliers of the data shown in the line plot.Then describe the data using them.
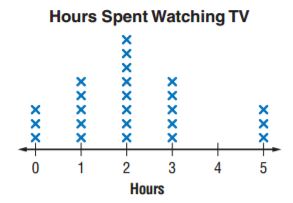
The line plot shows the number of hours students spend watching TV each night Describe the data. Include measures of center and variability. Round to the nearest tenth if necessary.
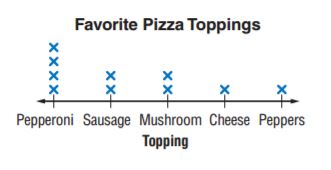
Justify Conclusions The line plot shows studentefavorite pizza toppings. Which can you find using the line plot: the median, mode, range, or outlier(s)? Explain. Then write a sentence or two to describe the data set. Explain your reasoning to a classmate.
 Dear guest, you are not a registered member. As a guest, you only have read-only access to our books, tests and other practice materials.
 (request help)

 (show solution)