Dear guest, you are not a registered member. As a guest, you only have read-only access to our books, tests and other practice materials.
As a registered member you can:
View all solutions for free
Request more in-depth explanations for free
Ask our tutors any math-related question for free
Email your homework to your parent or tutor for free
Registration is free and doesn't require any type of payment information. Click here to
Register.
Grade 8 HMH Go Math - Answer Keys
Chapter 14:Scatter Plots; Model Quiz
Please share this page with your friends on FaceBook
Readyto Go On?
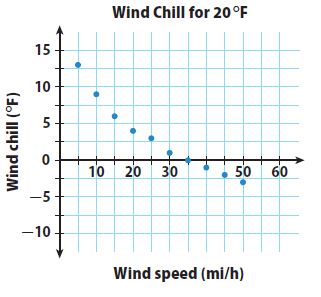
14.1 Scatter Plots and Association
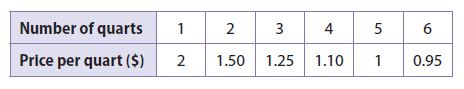
An auto store is having a sale on motor oil. The chart shows the price per quart as the number of quarts purchased increases. Use the data for Exs. 1–2.
 Dear guest, you are not a registered member. As a guest, you only have read-only access to our books, tests and other practice materials.
 (request help)
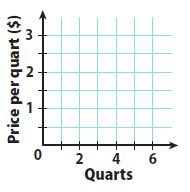
 (show solution)