Dear guest, you are not a registered member. As a guest, you only have read-only access to our books, tests and other practice materials.
As a registered member you can:
- View all solutions for free
- Request more in-depth explanations for free
- Ask our tutors any math-related question for free
- Email your homework to your parent or tutor for free
Registration is free and doesn't require any type of payment information. Click here to
Register.
Grade 8 HMH Go Math - Answer Keys
Chapter 14:Scatter Plots; Mixed Review
Please share this page with your friends on FaceBook
Selected Response |
-
Question 1
 (request help) (request help)
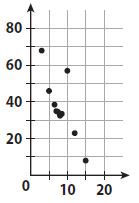
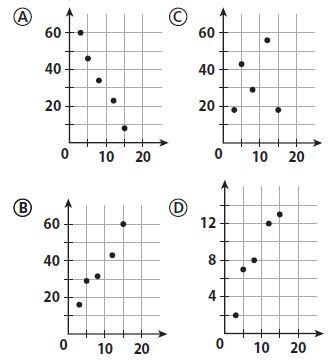
Which scatter plot could have a trend line whose equation is \(\text{y} = 3\text{x} + 10\)?
-
-
-
-
|
-
Question 2
(request help)
What type of association would you expect between a person’s age and hair length?
-
-
-
-
|
|
|
-
Question 4
(request help)
A restaurant claims to have served 352,000,000 hamburgers. What is this number in scientific notation?
-
-
-
-
|
-
Question 5
(request help)
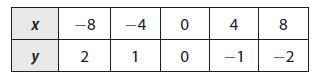
Which equation describes the relationship between x and y in the table?
-
-
-
-
|
Mini-Task |
-
Question 6
(request help)
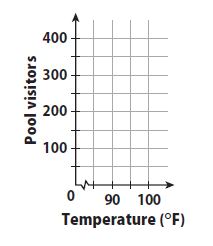
Use the data in the table.
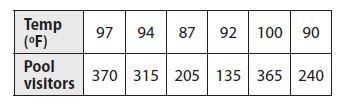
a. Make a scatterplot of the data.
Type below:
|
-
Question 6
(request help)
b. Which data point is an outlier?
Type below:
|
-
Question 6
(request help)
c. Predict the number of visitors on a day when the high temperature is 102 °F.
Type below:
|
 (show solution)