 Dear guest, you are not a registered member. As a guest, you only have read-only access to our books, tests and other practice materials.
As a registered member you can:
- View all solutions for free
- Request more in-depth explanations for free
- Ask our tutors any math-related question for free
- Email your homework to your parent or tutor for free
Registration is free and doesn't require any type of payment information. Click here to
Register.
Grade 8 McGraw Hill Glencoe - Answer Keys
Please share this page with your friends on FaceBook
Independent Practice |
-
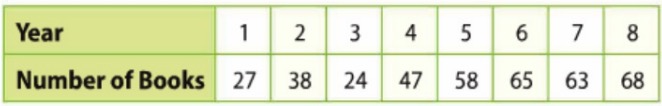
Question 1
 (request help) (request help)
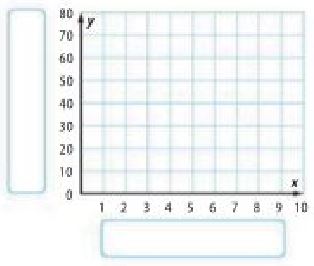
Construct a scatter plot of the number of books donated over time.
Type below:
|
-
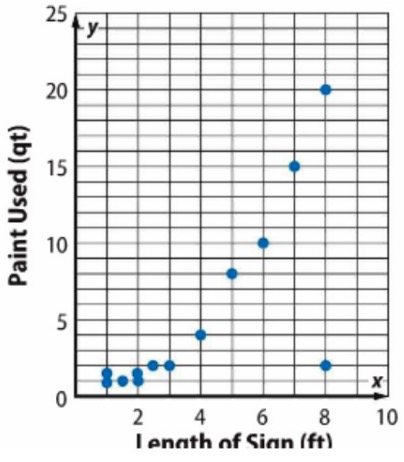
Question 2
(request help)
Interpret the scatter plot of the data for the amount of paint used to signs of various lenghts based on the shape of the distribution.
Type below:
|
-
Question 3
(request help)
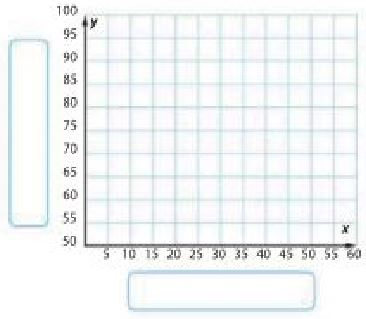
The table shows the amount of time different students studied for a test and their test scores.
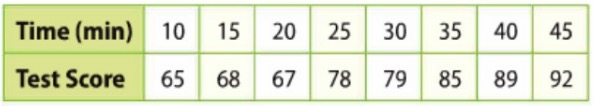
a. Construct a scatter plot of the data.
Type below:
|
-
Question 3
(request help)
b. Interpret the scatter plot of the data based on the shape of the distribution.
Type below:
|
-
Question 3
(request help)
c. If the relationship exists, make a conjecture about the test score for a student who studied for 60 minutes.
Type below:
|
 (show solution)