Make a Conjecture Suppose a scatter plot shows that as the values of x decrease, the values of y decrease. Does the scatter plot show a positive, negative, or no association?
Persevere with Problems Is it always, sometimes, or never true that a scatter plot that shows a positive association suggests that the relationship is proportional? Justify your answer.
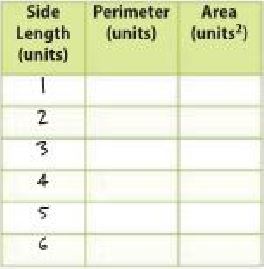
Reason Inductively Complete the table that shows the side lengths of a square related to its perimeter and area. Would a scatter plot of the side length and perimeter or the side length and area represent a linear relationship? Explain.
 Dear guest, you are not a registered member. As a guest, you only have read-only access to our books, tests and other practice materials.

 (request help)
 (show solution)