 Dear guest, you are not a registered member. As a guest, you only have read-only access to our books, tests and other practice materials.
As a registered member you can:
- View all solutions for free
- Request more in-depth explanations for free
- Ask our tutors any math-related question for free
- Email your homework to your parent or tutor for free
Registration is free and doesn't require any type of payment information. Click here to
Register.
Grade 8 McGraw Hill Glencoe - Answer Keys
Please share this page with your friends on FaceBook
Guided Practice |
-
Question 1
 (request help) (request help)
The table shows the life expectancy, in years, for people born in certain years.
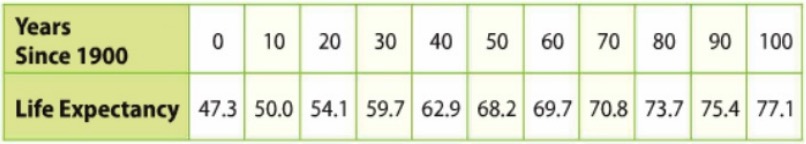
a. Construct a scatter plot for the data. Then draw and assess a line that best represents the data.
Type below:
|
-
Question 1
(request help)
b. Write an equation in slope-intercept form for the line of fit and interpret the slope and y-intercept.
Type below:
|
-
Question 1
(request help)
c. Use the equation to make a conjecture about the life expectancy for a person born in 2020.
Type below:
|
-
Question 2
(request help)
Building on the Essential Question Why do we estimate a line of best fit for a scatter plot?
Type below:
|
 (show solution)