 Dear guest, you are not a registered member. As a guest, you only have read-only access to our books, tests and other practice materials.
As a registered member you can:
- View all solutions for free
- Request more in-depth explanations for free
- Ask our tutors any math-related question for free
- Email your homework to your parent or tutor for free
Registration is free and doesn't require any type of payment information. Click here to
Register.
Grade 8 McGraw Hill Glencoe - Answer Keys
Please share this page with your friends on FaceBook
Independent Practice |
-
Question 1
 (request help) (request help)
The results of a survey about women's shoe sizes and heights are shown.
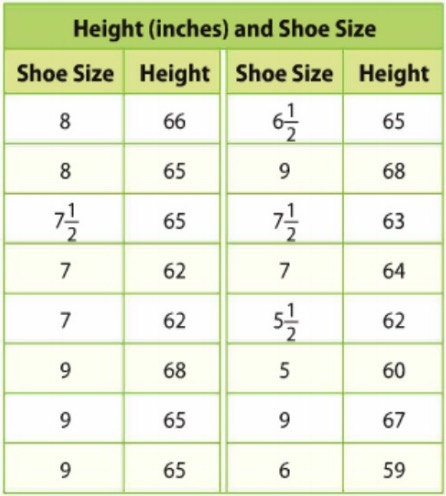
a. Construct a scatter plot for the data. Then draw and assess a line that best represents the data.
Type below:
|
-
Question 1
(request help)
b. Use the line of best fit to make a conjecture about the height of a female who wears a size 5 shoe.
Type below:
|
-
Question 2
(request help)
The table shows the number of Calories burned when walking laps around a track.
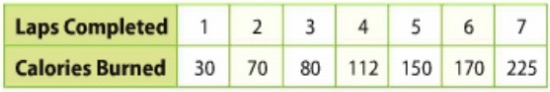
a. Construct a scatter plot for the data. Then draw and assess a line that best represents the data.
Type below:
|
-
Question 2
(request help)
b. Write an equation for the line of best fit. Use the equation to make a conjecture about the number of Calories burned if someone walks 15 laps.
Type below:
|
-
Question 3
(request help)
The scatter plot shows the number of girls who participate in ince hockey.
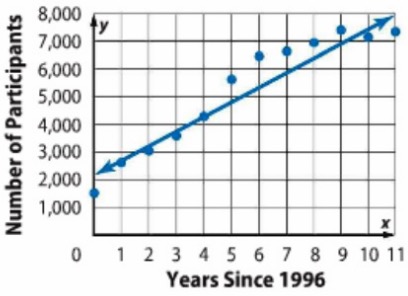
a. Write an equation in slope-intercept form for the line of best fit that is drawn, and interpret the slope and y-intercept.
Type below:
|
-
Question 3
(request help)
b. Use the equation to make a conjecture about the number of girls that will participate in ice hockey in 2020.
Type below:
|
 (show solution)