×
Dear guest, you are not a registered member . As a guest, you only have read-only access to our books, tests and other practice materials.
As a registered member you can:
View all solutions for free
Request more in-depth explanations for free
Ask our tutors any math-related question for free
Email your homework to your parent or tutor for free
Registration is free and doesn't require any type of payment information. Click here to
Register .
Grade 8 McGraw Hill Glencoe - Answer Keys
Please share this page with your friends on FaceBook
Extra Practice
Copy and Solve For Exercises 7-17, show your work and answers on a separate piece of paper.
Question 7
The winning scores for twenty Super Bowls are shown in the histogram below. Describe the shape of the distribution. Identify any clusters, gaps, peaks, or outliers.
Type below:
Question 8
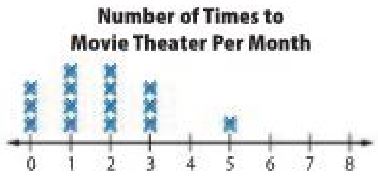
Wyatt took a survey of the number of times his classmates went to the movies this month. The results are shown in the line plot below.
a . Describe the shape of the distribution. Identify any clusters, gaps, peaks, or outliers.
Type below:
Question 8
b . Describe the center and spread of the distribution. Justify your response based on the shape of the distribution.
Type below:
Question 9
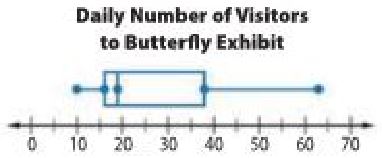
The box plot shows the visitor to a butterfly exhibit each day for a month.
a . Describe the shape of the distribution using symmetry and outliers.
Type below:
Question 9
b . Describe the center and spread of the distribution. Justify your response based on the shape of the distribution.
Type below:
Question 10
Justify Conclusions
Type below:
 Dear guest, you are not a registered member. As a guest, you only have read-only access to our books, tests and other practice materials.
 (request help)
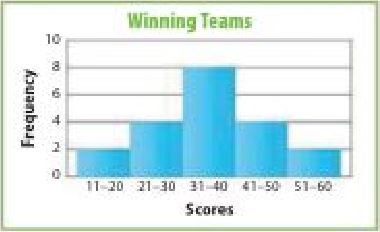
 (show solution)