×
Dear guest, you are not a registered member . As a guest, you only have read-only access to our books, tests and other practice materials.
As a registered member you can:
View all solutions for free
Request more in-depth explanations for free
Ask our tutors any math-related question for free
Email your homework to your parent or tutor for free
Registration is free and doesn't require any type of payment information. Click here to
Register .
Grade 8 McGraw Hill Glencoe - Answer Keys
Please share this page with your friends on FaceBook
Power Up
Test Practice
Question 11
The box plot shows the number of hours spent working on a science project by students. Determine if each statement is a valid conclusion based on the box plot. Select yes or no.
a . The distribution is symmetric.
b . The median is the best measure to describe the center.
c . There is an outlier at 2.
Question 12
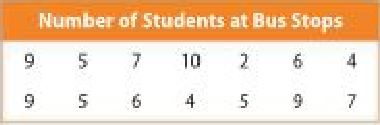
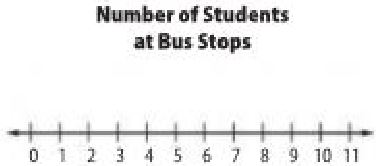
The list of data shows the number of students at different bus stops on Mr. Carter's route. Construct a line plot of the data.
Circle the correct term to make each statement true.
a . The distribution is (symmetric, not symmetric).
b . There is a (gap, cluster) between 4 and 7.
c . The (mean, median) is the best measure to describe the center.
Type below:
Spiral Review
Select an appropriate display for each situation. Choose from the list shown.
Bar Graph Line Graph
Box Plot Line PLot
Circle Graph Double Bar Graph
Scatter Plot Double Line Graph
Histogram Double Box Plot
Question 13
the number of cell phone subscribers for the past 5 years
Type below:
Question 14
point totals for the top 10 NASCAR drivers
Type below:
Question 15
the portion of a family's budget assigned to each category
Type below:
Question 16
the median of the exam scores for one class
Type below:
 Dear guest, you are not a registered member. As a guest, you only have read-only access to our books, tests and other practice materials.
 (request help)
 (show solution)